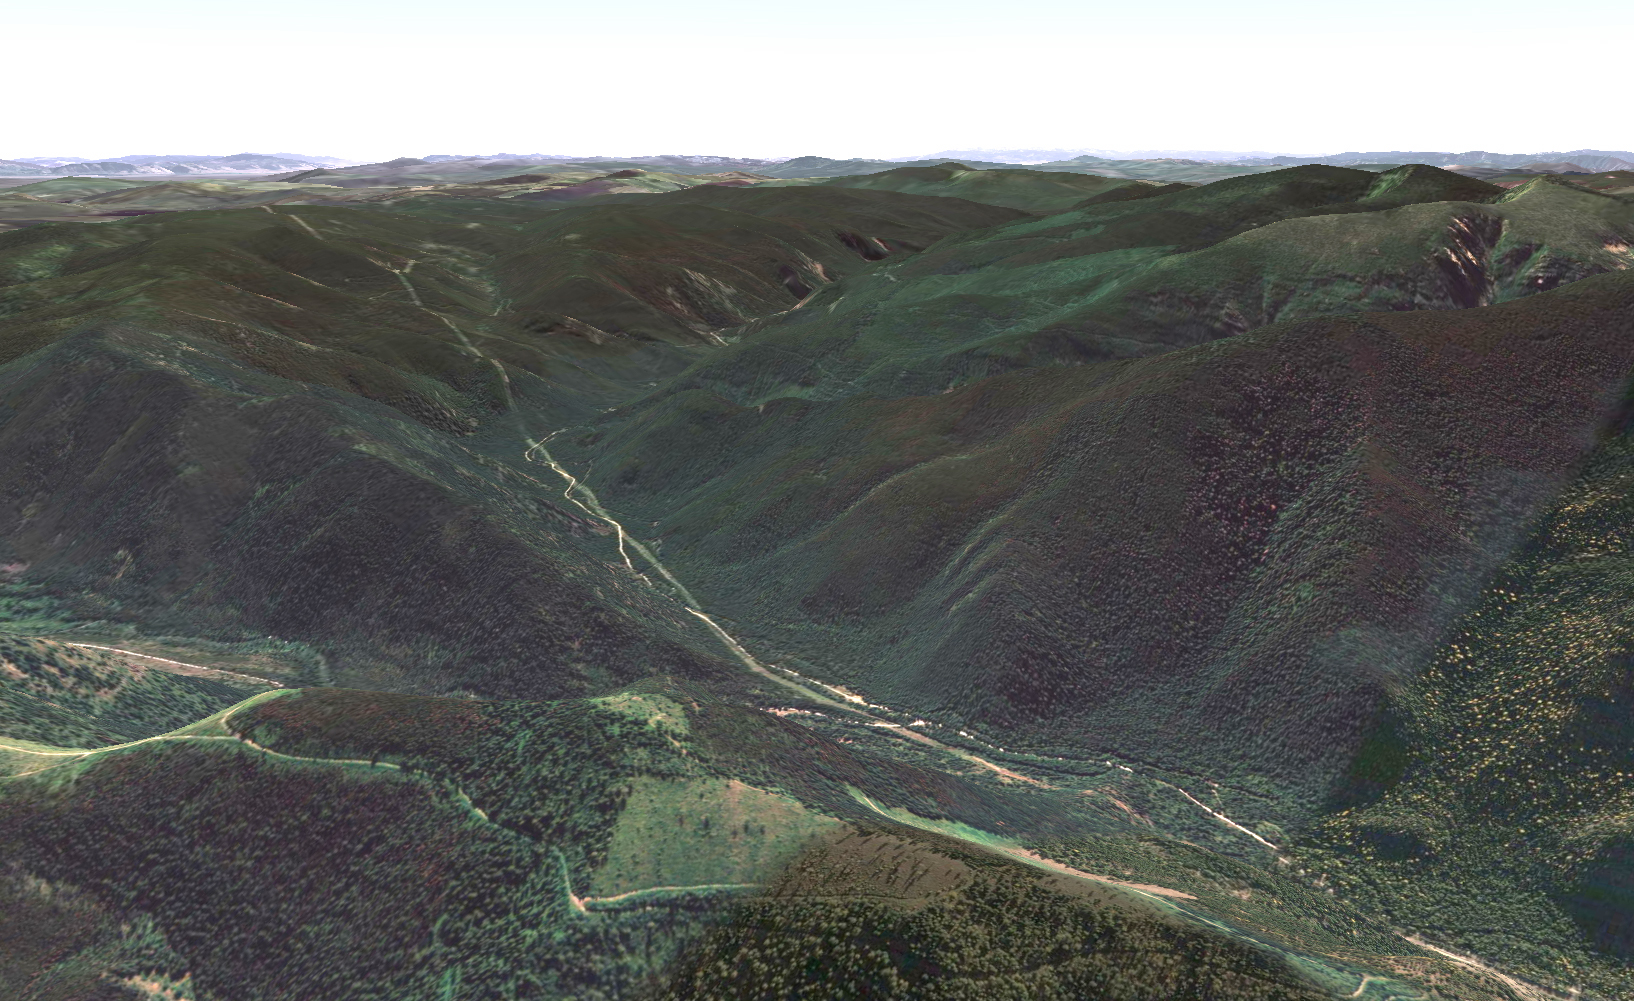
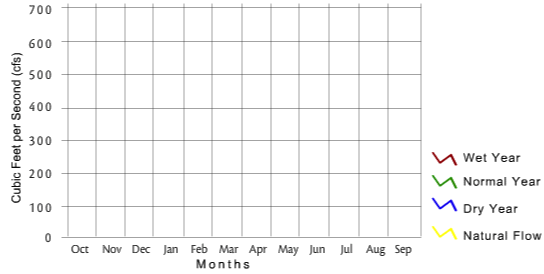
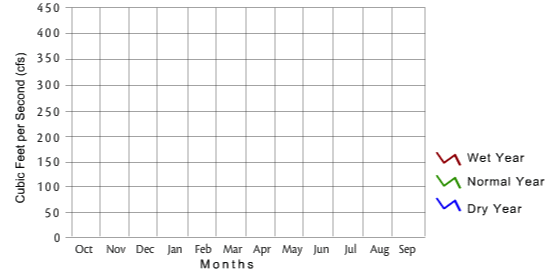
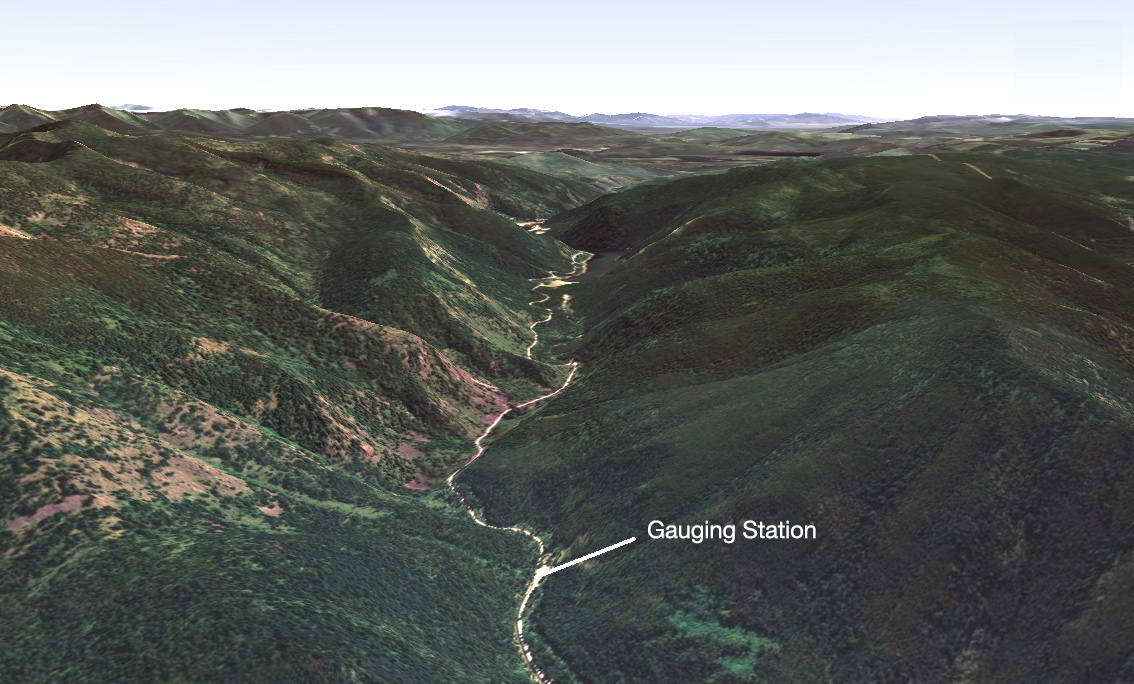
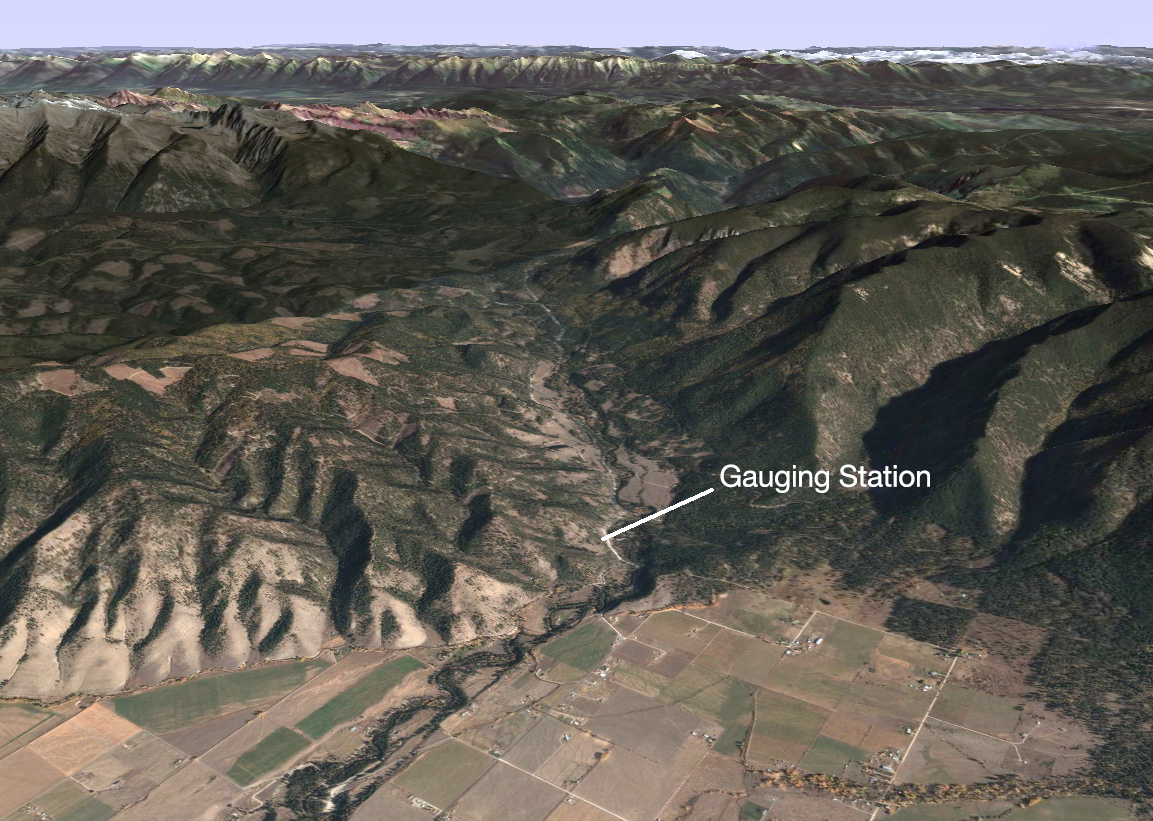
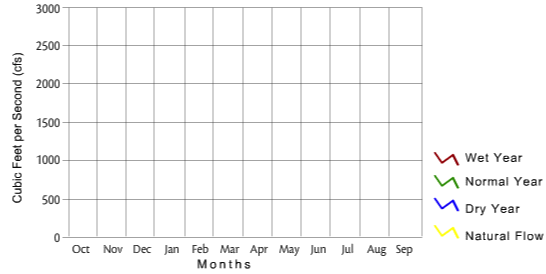
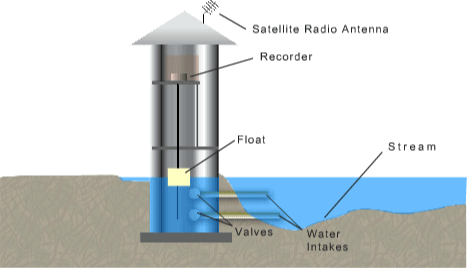
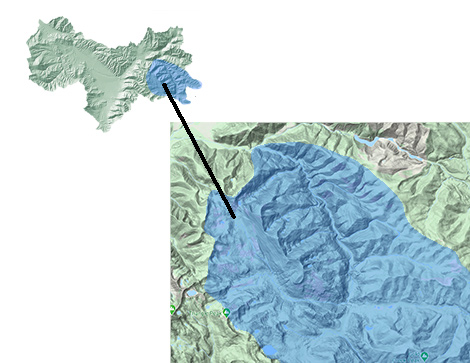
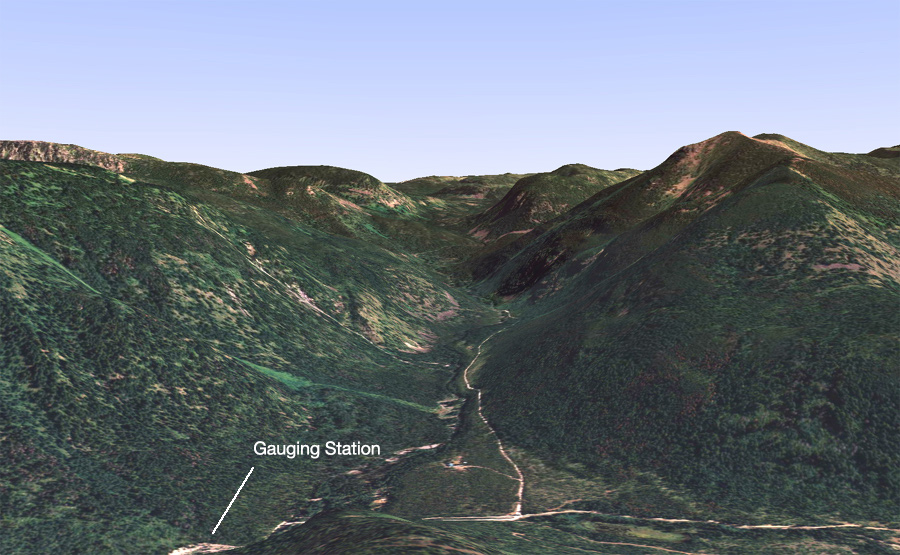
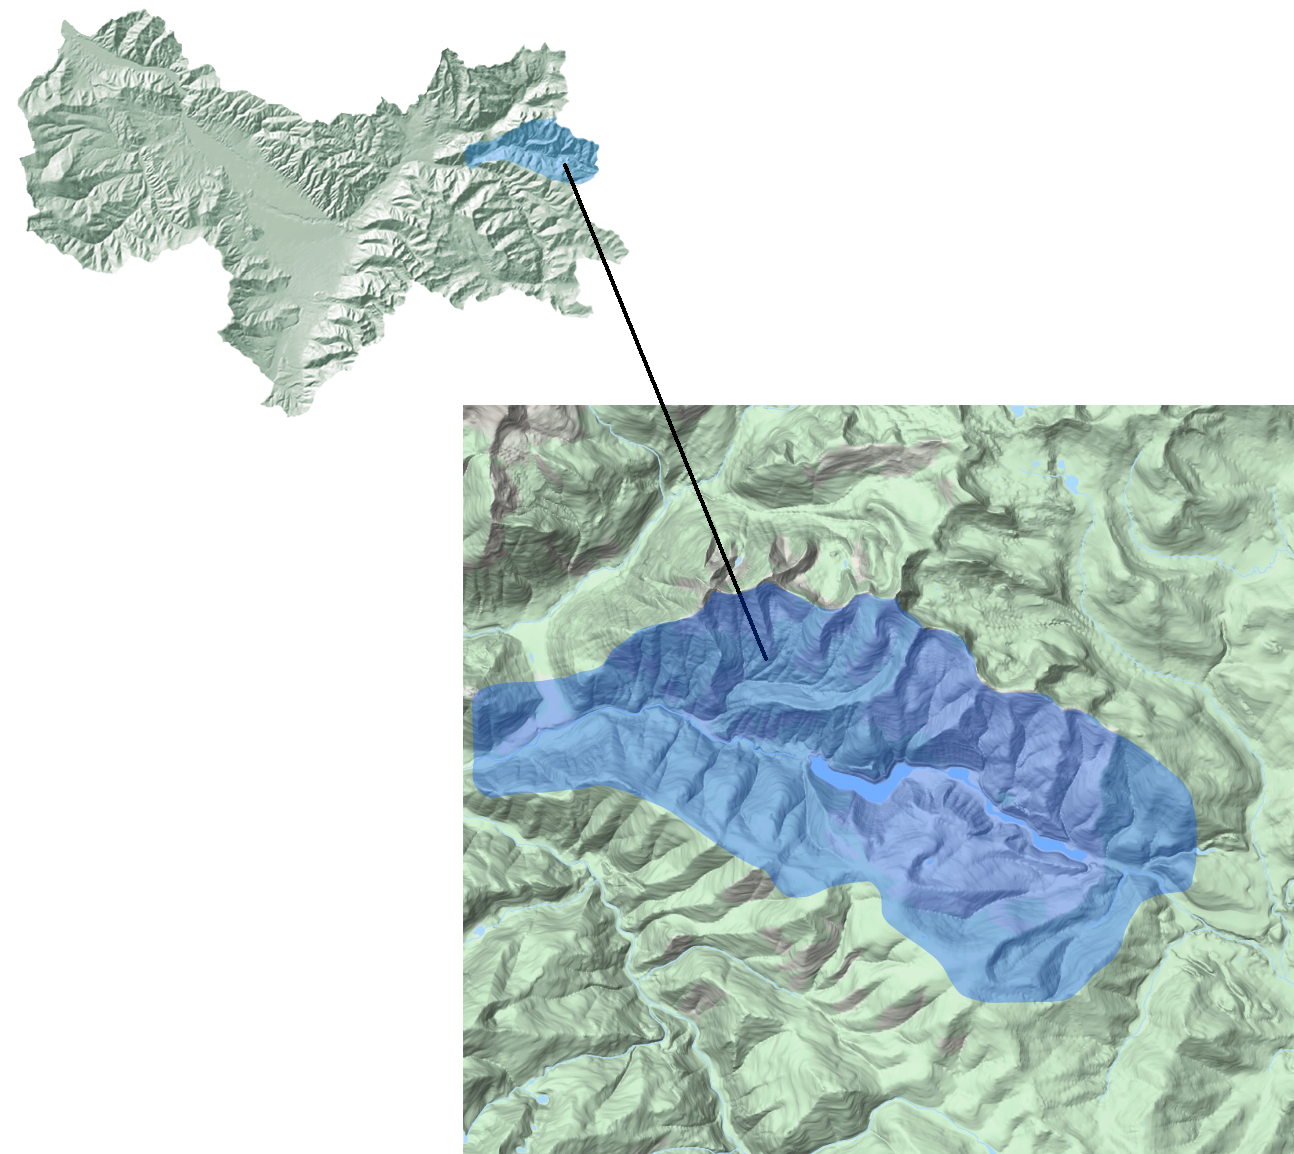
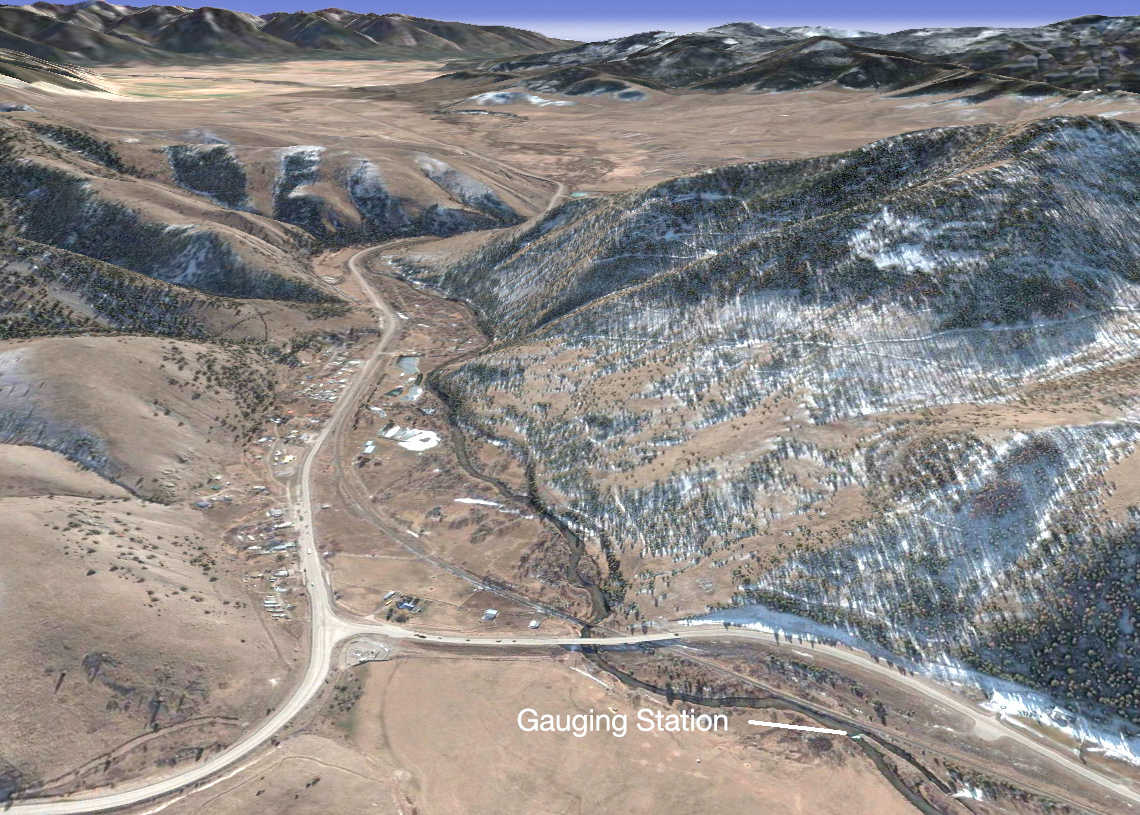
Hydrology: Jocko River Hydrographs

Hydrographs are one of the primary tools used by hydrologists. Hydrographs show the change in stream flow over time, so they reveal a lot about how a stream functions and the effects of human developments like irrigation. Click on a tab to explore the topics below.

    What's a Hydrograph

    What's a Hydrograph

    A hydrograph shows the amount of water flowing in a stream over a period of time. One cubic foot per second (cfs) is equal to one cubic foot of water flowing by every second, a rate equivalent to about 7.48 gallons per second. The data for a hydrograph comes from a stream gauge. To read a hydrographic, pick a date and move up to where it intersects the graph. Then read horizontally to the left to the discharge of the stream for that date (click on the graph at right for an example of how to read a hydrograph.

    What's a Stream Gauge

    Click to Play

    What's a Stream Gauge

    A stream gauge measures streamflows. A hydrograph displays the data that the gauge generates. As the flow in the stream increases, the float rises. The gauge records that rise. Similarly, when the stream drops, the float falls, and the recorder documents that change. The results are recorded on a hydrograph.

    South Fork

    Click to Play

    Hydrograph for the South Fork of the Jocko River

    My Image

    At 40,395 acres, the South Fork of the Jocko drains the largest area of the three-headwater tributaries. The drainage basin is heavily glaciated. The South Fork of the Jocko River is generally confined between canyon walls or high terrace surfaces. Near the mouth, the channel is less confined and there is an increase in sinuosity and alternating pools and riffles. The South Fork Jocko River, has a natural hydrograph, which means its flows have not been significantly altered by irrigation withdrawls or dams. The flow pattern is typical of a snowmelt system with high peak-to-base-flow ratios.

    My Image
    North Fork

    Click to Play

    Hydrograph for the North Fork of the Jocko River

    My Image

    Streamflows in the North Fork of the Jocko River are no longer natural. Much of the flow is diverted into the Tabor Feeder Canal. In all but the wettest years, the peak flow part of the hydrograph is rerouted into the canal network.

    My Image
    Middle Fork

    Click to Play

    Hydrograph for the Middle Fork of the Jocko River

    My Image

    Streamflows in the Middle Fork of the Jocko River are no longer natural. In all but the wettest years, the peak flow part of the hydrograph is shifted from spring or early summer to mid to late summer.

    My Image
    Jocko below Big Knife

    Click to Play

    Hydrograph for the Jocko River below Big Knife Creek

    Streamflows in the Mainstem of the Jocko River below Big Knife Creek are no longer natural. The gauging station is located downstream of the largest diversion in the drainage, the K-Canal intake. As a result, peak flows are severely reduced in all but high water years.

    My Image
    Jocko below Lower J Canal

    Click to Play

    Hydrograph for the Jocko River below Lower J Canal

    Streamflows in the Mainstem of the Jocko River below the Lower J Canal are no longer natural. Streamflows here are very similar to those at the mouth of the Jocko. All tributaries have joined with the river, and there are no significant ground-water gaining areas between this site and the mouth. Peak flows are reduced by irrigation, but the withdrawals affect peak flows less because of the tributary and ground-water inflows.

    My Image

Hydrology: Jocko River Hydrographs

Hydrographs are one of the primary tools used by hydrologists. Hydrographs show the change in stream flow over time, so they reveal a lot about how a stream functions and the effects of human developments like irrigation. Click on a tab to explore the topics below.

    What's a Hydrograph

    What's a Hydrograph

    A hydrograph shows the amount of water flowing in a stream over a period of time. One cubic foot per second (cfs) is equal to one cubic foot of water flowing by every second, a rate equivalent to about 7.48 gallons per second. The data for a hydrograph comes from a stream gauge. To read a hydrographic, pick a date and move up to where it intersects the graph. Then read horizontally to the left to the discharge of the stream for that date (click on the graph at right for an example of how to read a hydrograph.

    What's a Stream Gauge

    Click to Play

    What's a Stream Gauge

    A stream gauge measures streamflows. A hydrograph displays the data that the gauge generates. As the flow in the stream increases, the float rises. The gauge records that rise. Similarly, when the stream drops, the float falls, and the recorder documents that change. The results are recorded on a hydrograph.

    South Fork

    Click to Play

    Hydrograph for the South Fork of the Jocko River

    My Image

    At 40,395 acres, the South Fork of the Jocko drains the largest area of the three-headwater tributaries. The drainage basin is heavily glaciated. The South Fork of the Jocko River is generally confined between canyon walls or high terrace surfaces. Near the mouth, the channel is less confined and there is an increase in sinuosity and alternating pools and riffles. The South Fork Jocko River, has a natural hydrograph, which means its flows have not been significantly altered by irrigation withdrawls or dams. The flow pattern is typical of a snowmelt system with high peak-to-base-flow ratios.

    North Fork

    Click to Play

    Hydrograph for the North Fork of the Jocko River

    My Image

    Streamflows in the North Fork of the Jocko River are no longer natural. Much of the flow is diverted into the Tabor Feeder Canal. In all but the wettest years, the peak flow part of the hydrograph is rerouted into the canal network.

    Middle Fork

    Click to Play

    Hydrograph for the Middle Fork of the Jocko River

    My Image

    Streamflows in the Middle Fork of the Jocko River are no longer natural. In all but the wettest years, the peak flow part of the hydrograph is shifted from spring or early summer to mid to late summer.

    Jocko below Big Knife

    Click to Play

    Hydrograph for the Jocko River below Big Knife Creek

    Streamflows in the Mainstem of the Jocko River below Big Knife Creek are no longer natural. The gauging station is located downstream of the largest diversion in the drainage, the K-Canal intake. As a result, peak flows are severely reduced in all but high water years.

    Jocko below Lower J Canal

    Click to Play

    Hydrograph for the Jocko River below Lower J Canal

    Streamflows in the Mainstem of the Jocko River below the Lower J Canal are no longer natural. Streamflows here are very similar to those at the mouth of the Jocko. All tributaries have joined with the river, and there are no significant ground-water gaining areas between this site and the mouth. Peak flows are reduced by irrigation, but the withdrawals affect peak flows less because of the tributary and ground-water inflows.